
CURVESERIES GRAPHIC USER INTERFACE
Transform Commodity Data into Powerful Insights
🗹 Interactive Charts
🗹 Dynamic Dashboards
🗹 Customizable Visualization Features
🗹 User-Friendly Experience
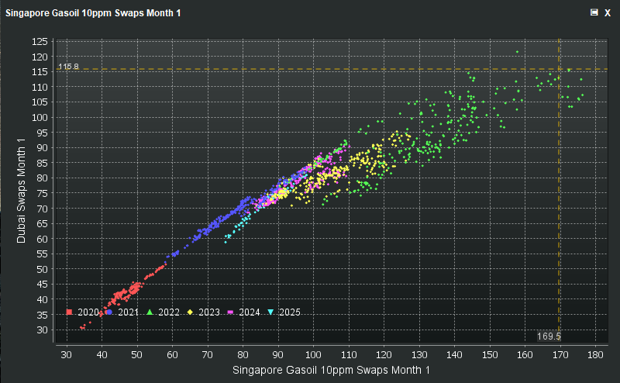
CURVESERIES is a leading data visualization platform that seamlessly integrates commodity price data, advanced data analysis and price forecasting into one cohesive experience. Designed with user efficiency in mind, it offers a suite of customizable visualization options, including interactive charts, graphs, and dynamic dashboards, to transform raw data into actionable insights with clarity and precision.
Equipped with advanced data analysis capabilities and sophisticated statistical functions, the platform facilitates the efficient manipulation and exploration of large datasets. Users can perform complex analyses with ease, leveraging powerful tools and trend analysis to uncover hidden patterns and trends in commodity price data. By leveraging our comprehensive historical data to analyze past price movements and trends, users can effectively anticipate future price changes, thereby enhancing their strategic planning and decision-making.

The platform is engineered to simplify intricate processes, presenting information in a clear and accessible manner. This approach not only enhances the usability of the system but also empowers users to make informed decisions quickly. By prioritizing both robust functionality and ease of use, Curveseries ensures effective data management and a streamlined user experience.