The Definitive Guide to Commodity Price Analytics for Energy Markets
 06 Oct 2026
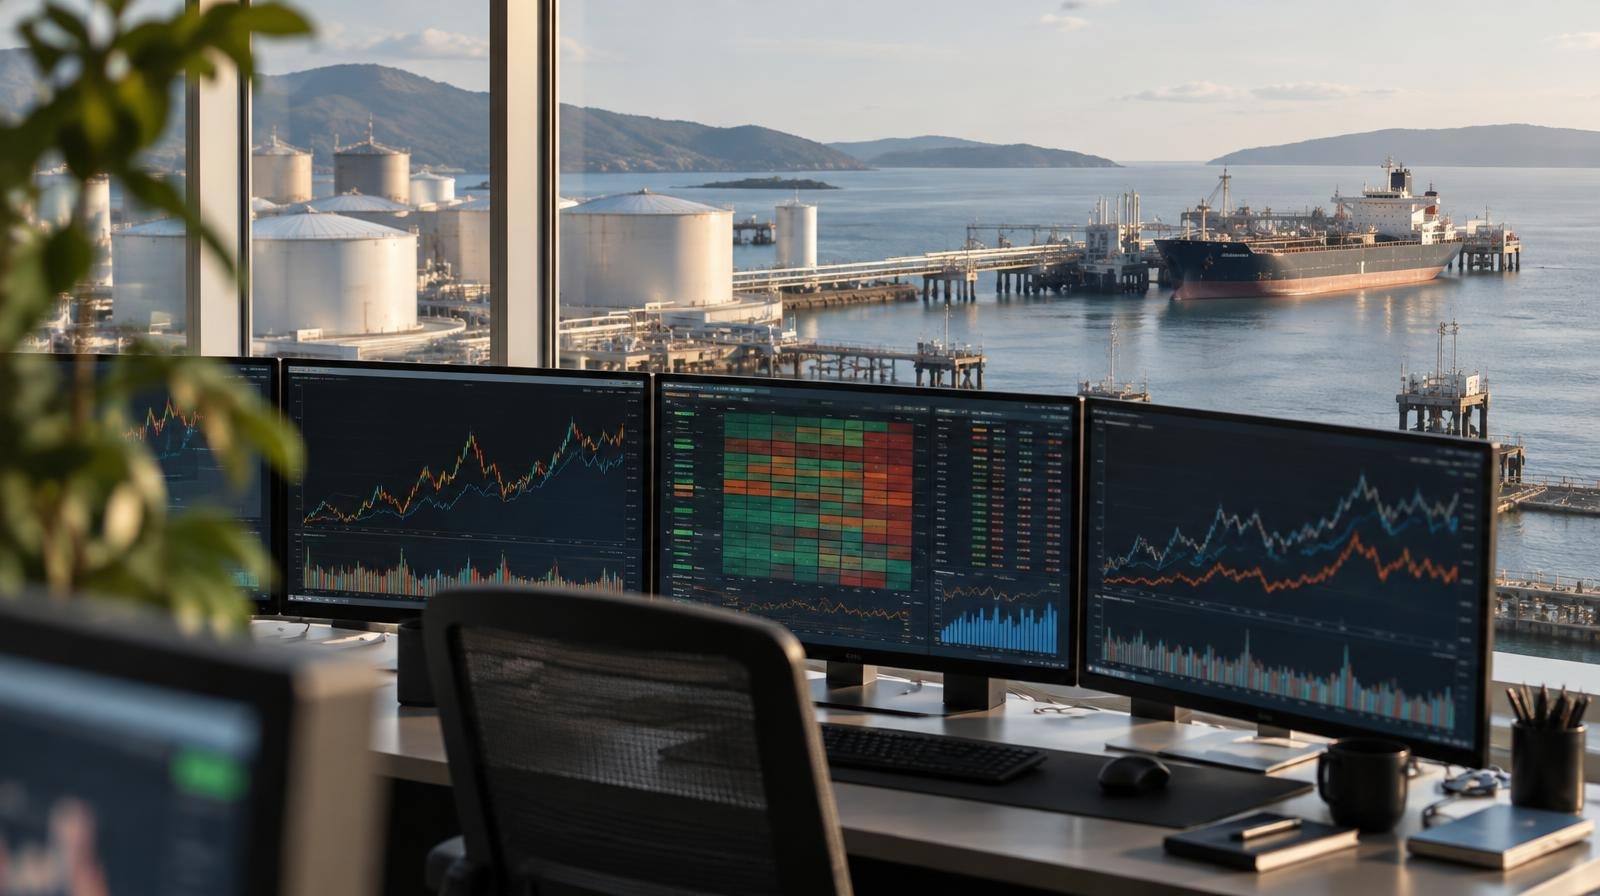
In today’s volatile energy markets, gaining a competitive edge requires more than just access to live oil prices; it demands a sophisticated approach to data analysis. An oil price analytics platform provides the specialized infrastructure necessary for traders, risk managers, and strategic planners to transform raw data into actionable intelligence. These platforms move beyond the limitations of generalist financial terminals by offering granular insights into commodity forward curves, historical price movements, and complex over-the-counter (OTC) instruments, creating a single source of truth for critical decision-making.
What Defines a Modern Oil Price Analytics Platform?
A modern oil price analytics platform is a specialized software solution that centralizes vast datasets, including historical and forward curves, OTC prices, and proprietary data, to provide traders with advanced visualization, backtesting, and strategic planning tools for navigating complex energy markets. It is architected to handle the unique complexities of energy commodities, offering functionalities that generic data terminals cannot match. The core of such a platform rests on its ability to integrate disparate data streams into a cohesive, analyzable whole, which is a critical function for global asset management.
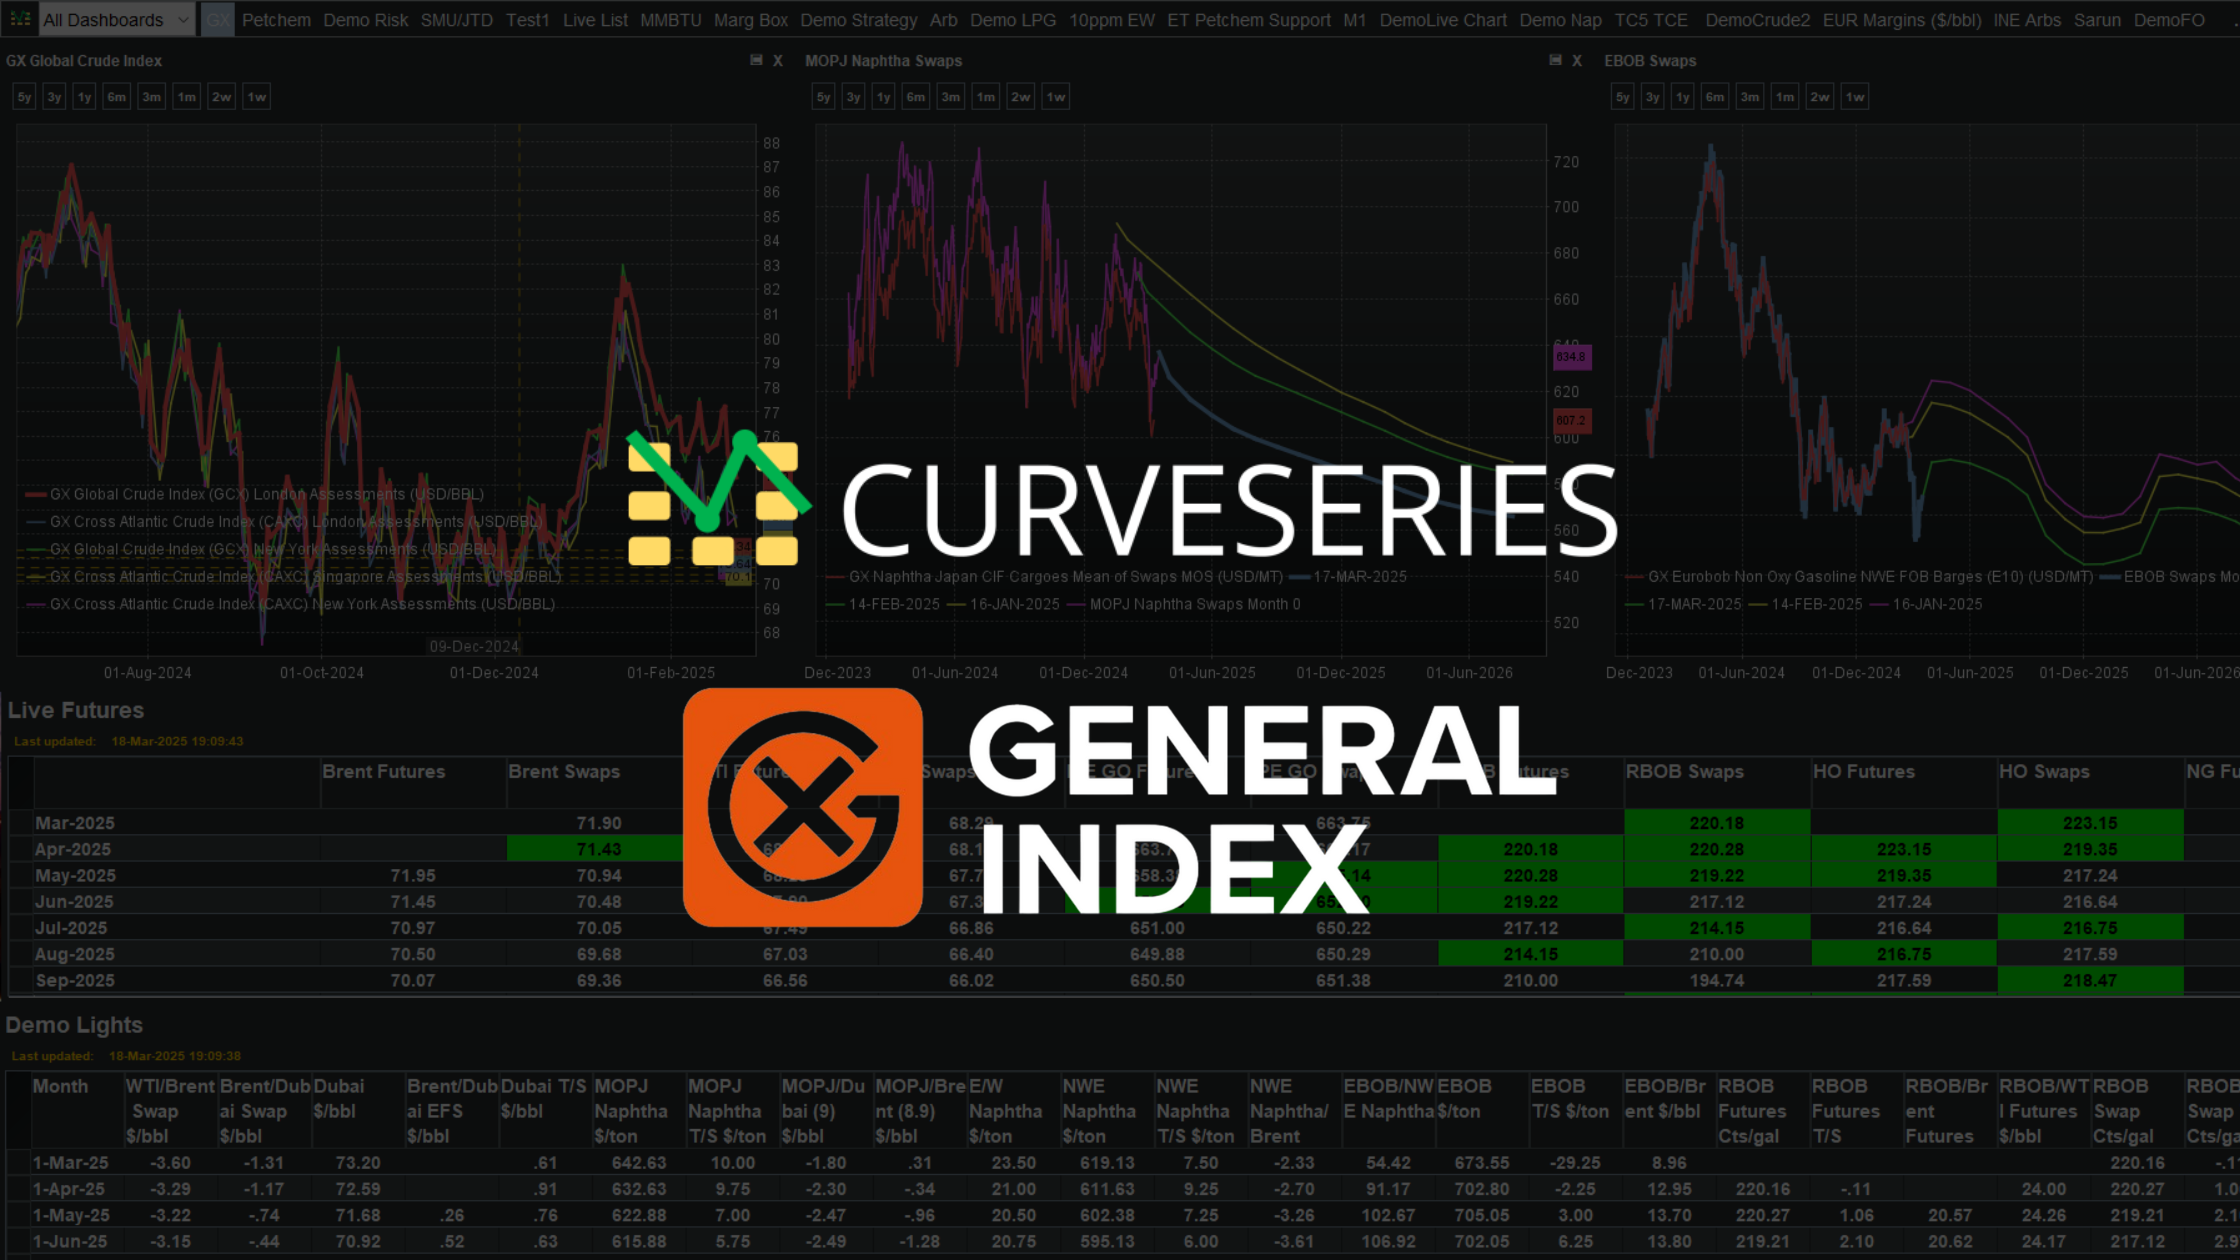
At its foundation, a leading platform must provide an extensive database of commodity contracts, often numbering over 300, with deep historical data. For instance, having reliable forward curve analytics dating back to 2012, with all data marked to a consistent timestamp like 16:30 London time, is crucial. This level of data integrity ensures that when a quantitative analyst backtests a strategy, such as mean reversion trading, they can use the full history without needing to filter for noise. The platform should also project forward curves at least 24 months into the future, enabling long-term strategic planning. A key differentiator is an advanced Graphical User Interface (GUI) that simplifies the visualization of this complex information, allowing users to manage hundreds of contracts simultaneously. Furthermore, integration with proprietary tools is essential. A feature like a ShareExcel tool allows users to synchronize their own Excel data to a secure cloud database in real time, bridging the gap between local models and a centralized analytics environment.
How to Implement Advanced Analytics in Energy Trading
Implementing advanced analytics involves integrating diverse data sources into a unified platform, utilizing specialized charting tools to identify market patterns like mean reversion, and leveraging historical forward curve analytics for robust backtesting of trading strategies to gain a competitive edge. The first step is to consolidate all relevant data into a single environment. This process involves using the platform to pull in and automatically standardize outputs from various data APIs, such as S&P Global and Rim Intelligence, alongside internal trade data. This unification of fragmented sources creates a holistic view that combines both physical and financial market perspectives.
Once data is centralized, traders can deploy specific analytical techniques. For comparing current oil swap price data to historical physical benchmarks, rolling contract charts are highly effective. These charts display the same contracts over the years, enabling direct, apples-to-apples comparisons of performance during similar seasonal periods. For identifying arbitrage, strategists can overlay real-time OTC price data feeds against long-term historical seasonality patterns. This technique makes it possible to spot ‘broken’ spreads that deviate from established multi-year norms. The platform’s deep, clean historical dataset, dating back over a decade, provides the statistical foundation for backtesting these strategies with confidence.
| Feature | Traditional Excel-Based Analysis | Integrated Oil Price Analytics Platform |
|---|---|---|
| Data Integration | Manual copy-paste from multiple sources; prone to errors. | Automated API feeds from sources like S&P Global and Rim Intelligence plus proprietary data sync. |
| Collaboration | Difficult to share live data due to local macros; version control issues. | Centralized cloud database with tools like ShareExcel for real-time value synchronization. |
| Historical Analysis | Limited by spreadsheet capacity; data cleaning is a manual, intensive process. | Access to extensive, clean historical data, such as records since 2012, for immediate backtesting. |
| Forward Curves | Manual construction; difficult to project accurately and maintain. | Automated generation of commodity forward curves projected 24+ months into the future. |
| Technical Reliability | Dependent on local machine performance and file integrity. | Proven technical reliability, including over 4.5 years of zero server downtime. |
Common Pitfalls in Commodity Data Analysis and How to Avoid Them
Common pitfalls in commodity data analysis include relying on fragmented or uncleaned data, using generalist tools that lack market-specific depth, and failing to integrate proprietary insights with external benchmarks. All of these can be mitigated by adopting a specialized, unified analytics platform. One of the most frequent errors is using data from multiple sources without proper normalization. This creates inconsistencies in timestamps, contract naming, and quality, leading to flawed analysis. The solution is a platform that automatically ingests and standardizes data from different APIs into a single, clean ‘source of truth’.
Another significant challenge is the data silo created by over-reliance on disconnected spreadsheets. Many traders and risk managers use macro-based or VBA-coded programs that provide live prices to their local Excel sheets. This workflow prevents effective team collaboration, as these complex sheets cannot be shared with live prices intact. This pitfall is overcome with tools designed to bridge this gap, such as a utility that uploads only the values from Excel to a central database, rather than the formulas or macros. This approach avoids latency and allows a team to work from a single, synchronized dataset. For those looking to move past these issues, adopting a unified approach to commodity data management is the most effective path forward. Finally, traders often misinterpret liquidity across the forward curve, treating long-dated contracts the same as near-term ones. A robust GUI should be configured to visually distinguish between the highly liquid front months and the less frequently updated price points in the outer months, ensuring risk is assessed accurately across all time horizons.
Frequently Asked Questions
- What is the main advantage of a specialized oil price analytics platform over a generalist financial terminal?
The main advantage is market-specific depth. A specialized platform offers granular tools for commodity forward curve analytics, integrates niche data feeds like oil OTC data, and provides a GUI designed to visualize complex energy market relationships, functionalities that generalist terminals lack. - How does historical forward curve data improve trading strategy backtesting?
Access to a long and clean historical forward curve dataset, for example, one dating back to 2012 with a consistent methodology, allows quantitative analysts to test strategies like mean reversion across various market cycles with high confidence, without needing to discard data due to quality issues. - Can I integrate my proprietary Excel models with a cloud-based analytics platform?
Yes, modern platforms offer tools that synchronize data from your local Excel files to a secure cloud database. These tools are designed to upload only the final values, not complex formulas or macros, which prevents latency and allows your proprietary models to integrate seamlessly with the platform’s broader dataset.